Using the AWS Cloud Watch agent to publish metrics to CloudWatch in ROSA
This content is authored by Red Hat experts, but has not yet been tested on every supported configuration.
This document shows how you can use the AWS Cloud Watch agent to scrape Prometheus endpoints and publish metrics to CloudWatch in a Red Hat OpenShift Container Platform (ROSA) cluster.
It pulls from The AWS documentation for installing the CloudWatch agent to Kubernetes and collections and publishes metrics for the Kubernetes API Server and provides a simple Dashboard to view the results.
Currently the AWS Cloud Watch Agent does not support pulling all metrics from the Prometheus federated endpoint, but the hope is that when it does we can ship all Cluster and User Workload metrics to CloudWatch.
Prerequisites
Prepare AWS Account
Turn off AWS CLI Paging
export AWS_PAGER=""Set some environment variables
Change these to suit your environment.
export CLUSTER_NAME=metrics
export CLUSTER_REGION=us-east-2
export SCRATCH_DIR=/tmp/scratch
mkdir -p $SCRATCH_DIR
Create an AWS IAM User for Cloud Watch
aws iam create-user \
  --user-name $CLUSTER_NAME-cloud-watch \
  > $SCRATCH_DIR/aws-user.json
Fetch Access and Secret Keys for IAM User
aws iam create-access-key \
  --user-name $CLUSTER_NAME-cloud-watch \
  > $SCRATCH_DIR/aws-access-key.json
Attach Policy to AWS IAM User
aws iam attach-user-policy \
  --user-name $CLUSTER_NAME-cloud-watch \
  --policy-arn "arn:aws:iam::aws:policy/CloudWatchAgentServerPolicy"
Deploy Cloud Watch Prometheus Agent
Create a namespace for Cloud Watch
oc create namespace amazon-cloudwatchDownload the Cloud Watch Agent Kubernetes manifests
wget -O $SCRATCH_DIR/cloud-watch.yaml https://raw.githubusercontent.com/rh-mobb/documentation/main/content/rosa/metrics-to-cloudwatch-agent/cloud-watch.yamlUpdate the Cloud Watch Agent Kubernetes manifests
sed -i .bak "s/__cluster_name__/$CLUSTER_NAME/g" $SCRATCH_DIR/cloud-watch.yaml
sed -i .bak "s/__cluster_region__/$CLUSTER_REGION/g" $SCRATCH_DIR/cloud-watch.yaml
Provide AWS Creds to the Cloud Watch Agent
AWS_ID=`cat $SCRATCH_DIR/aws-access-key.json | jq -r '.AccessKey.AccessKeyId'`
AWS_KEY=`cat $SCRATCH_DIR/aws-access-key.json | jq -r '.AccessKey.SecretAccessKey'`

echo "[AmazonCloudWatchAgent]\naws_access_key_id = $AWS_ID\naws_secret_access_key = $AWS_KEY" \
  > $SCRATCH_DIR/credentials

oc --namespace amazon-cloudwatch \
  create secret generic aws-credentials \
  --from-file=credentials=$SCRATCH_DIR/credentials
Allow Cloud Watch Agent to run as Root user (inside the container)
oc -n amazon-cloudwatch adm policy \
  add-scc-to-user anyuid -z cwagent-prometheus
Apply the Cloud Watch Agent Kubernetes manifests
oc apply -f $SCRATCH_DIR/cloud-watch.yamlCheck the Pod is running
oc get pods -n amazon-cloudwatchYou should see:
NAME                                  READY   STATUS    RESTARTS   AGE
cwagent-prometheus-54cd498c9c-btmjm   1/1     Running   0          60m
Create Sample Dashboard
Download the Sample Dashboard
wget -O $SCRATCH_DIR/dashboard.json https://raw.githubusercontent.com/rh-mobb/documentation/main/content/rosa/metrics-to-cloudwatch-agent/dashboard.jsonUpdate the Sample Dashboard
sed -i .bak "s/__CLUSTER_NAME__/$CLUSTER_NAME/g" $SCRATCH_DIR/dashboard.json
sed -i .bak "s/__REGION_NAME__/$CLUSTER_REGION/g" $SCRATCH_DIR/dashboard.json
Browse to https://us-east-2.console.aws.amazon.com/cloudwatch
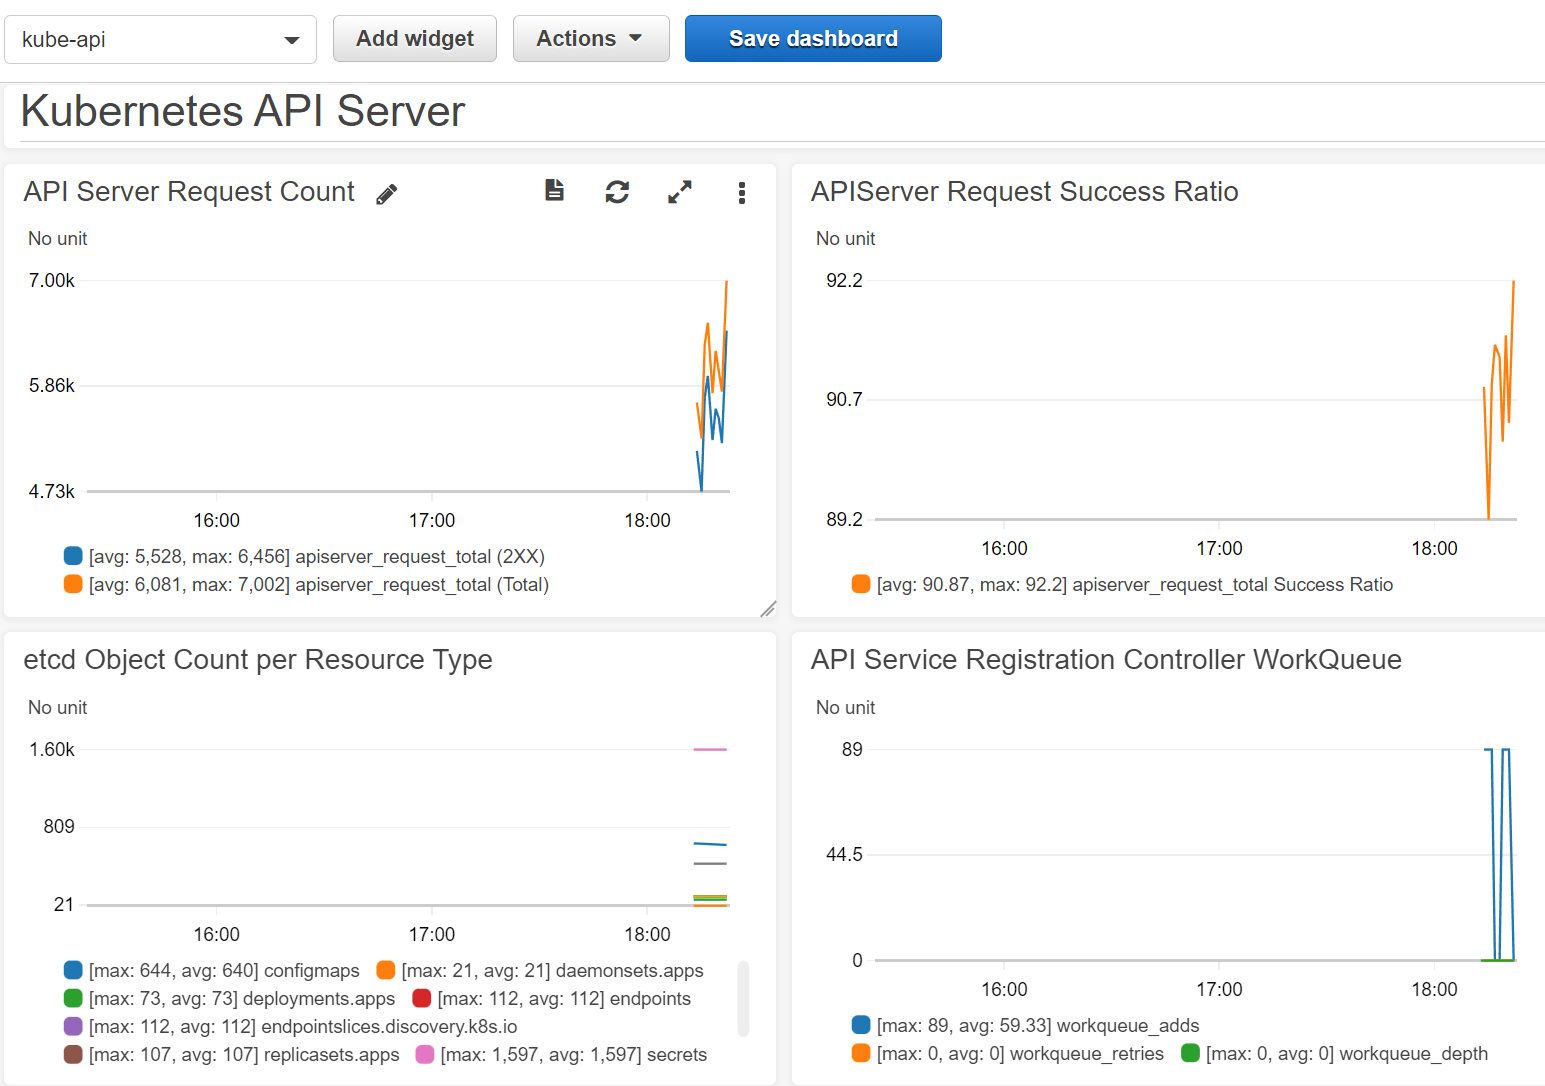
Create a Dashboard, call it “Kubernetes API Server”
Click Actions->View/edit source
Paste the JSON contents from
$SCRATCH_DIR/dashboard.jsoninto the text areaView the dashboard