Federating System and User metrics to S3 in Red Hat OpenShift for AWS
This content is authored by Red Hat experts, but has not yet been tested on every supported configuration.
This guide walks through setting up federating Prometheus metrics to S3 storage.
ToDo - Add Authorization in front of Thanos APIs
Prerequisites
Set up environment
Create environment variables
export CLUSTER_NAME=my-cluster
export S3_BUCKET=my-thanos-bucket
export REGION=us-east-2
export NAMESPACE=federated-metrics
export SA=aws-prometheus-proxy
export SCRATCH_DIR=/tmp/scratch
export OIDC_PROVIDER=$(oc get authentication.config.openshift.io cluster -o json | jq -r .spec.serviceAccountIssuer| sed -e "s/^https:\/\///")
export AWS_ACCOUNT_ID=$(aws sts get-caller-identity --query Account --output text)
export AWS_PAGER=""
rm -rf $SCRATCH_DIR
mkdir -p $SCRATCH_DIR
Create namespace
oc new-project $NAMESPACE
AWS Preperation
Create an S3 bucket
aws s3 mb s3://$S3_BUCKETCreate a Policy for access to S3
  cat <<EOF > $SCRATCH_DIR/s3-policy.json
  {
      "Version": "2012-10-17",
      "Statement": [
          {
              "Sid": "Statement",
              "Effect": "Allow",
              "Action": [
                  "s3:ListBucket",
                  "s3:GetObject",
                  "s3:DeleteObject",
                  "s3:PutObject",
                  "s3:PutObjectAcl"
              ],
              "Resource": [
                  "arn:aws:s3:::$S3_BUCKET/*",
                  "arn:aws:s3:::$S3_BUCKET"
              ]
          }
      ]
  }
  EOF
Apply the Policy
S3_POLICY=$(aws iam create-policy --policy-name $CLUSTER_NAME-thanos \
  --policy-document file://$SCRATCH_DIR/s3-policy.json \
  --query 'Policy.Arn' --output text)
echo $S3_POLICY
Create a Trust Policy
cat <<EOF > $SCRATCH_DIR/TrustPolicy.json
{
  "Version": "2012-10-17",
  "Statement": [
    {
      "Effect": "Allow",
      "Principal": {
        "Federated": "arn:aws:iam::${AWS_ACCOUNT_ID}:oidc-provider/${OIDC_PROVIDER}"
      },
      "Action": "sts:AssumeRoleWithWebIdentity",
      "Condition": {
        "StringEquals": {
          "${OIDC_PROVIDER}:sub": [
            "system:serviceaccount:${NAMESPACE}:${SA}"
          ]
        }
      }
    }
  ]
}
EOF
Create Role for AWS Prometheus and CloudWatch
S3_ROLE=$(aws iam create-role \
  --role-name "$CLUSTER-thanos-s3" \
  --assume-role-policy-document file://$SCRATCH_DIR/TrustPolicy.json \
  --query "Role.Arn" --output text)
echo $S3_ROLE
Attach the Policies to the Role
aws iam attach-role-policy \
  --role-name "$CLUSTER-thanos-s3" \
  --policy-arn $S3_POLICY
Deploy Operators
- Add the MOBB chart repository to your Helm
helm repo add mobb https://rh-mobb.github.io/helm-charts/ - Update your repositories
helm repo update - Use the
mobb/operatorhubchart to deploy the needed operatorshelm upgrade -n $echNAMESPACE custom-metrics-operators \ mobb/operatorhub --version 0.1.1 --install \ --values https://raw.githubusercontent.com/rh-mobb/helm-charts/main/charts/rosa-thanos-s3/files/operatorhub.yaml
Deploy Thanos Store Gateway
Deploy ROSA Thanos S3 Helm Chart
helm upgrade -n $NAMESPACE rosa-thanos-s3 --install mobb/rosa-thanos-s3 \
  --set "aws.roleArn=$ROLE_ARN" \
  --set "rosa.clusterName=$CLUSTER_NAME"
Append remoteWrite settings to the user-workload-monitoring config to forward user workload metrics to Thanos. Check if the User Workload Config Map exists:
oc -n openshift-user-workload-monitoring get \
  configmaps user-workload-monitoring-config
If the config doesn’t exist run:
cat << EOF | kubectl apply -f -
apiVersion: v1
kind: ConfigMap
metadata:
  name: user-workload-monitoring-config
  namespace: openshift-user-workload-monitoring
data:
  config.yaml: |
    prometheus:
      remoteWrite:
        - url: "http://thanos-receive.${NAMESPACE}.svc.cluster.local:9091/api/v1/receive"
EOF
Otherwise update it with the following:
oc -n openshift-user-workload-monitoring edit \ configmaps user-workload-monitoring-configdata: config.yaml: | ... prometheus: ... remoteWrite: - url: "http://thanos-receive.thanos-receiver.svc.cluster.local:9091/api/v1/receive"
Check metrics are flowing by logging into Grafana
get the Route URL for Grafana (remember its https) and login using username
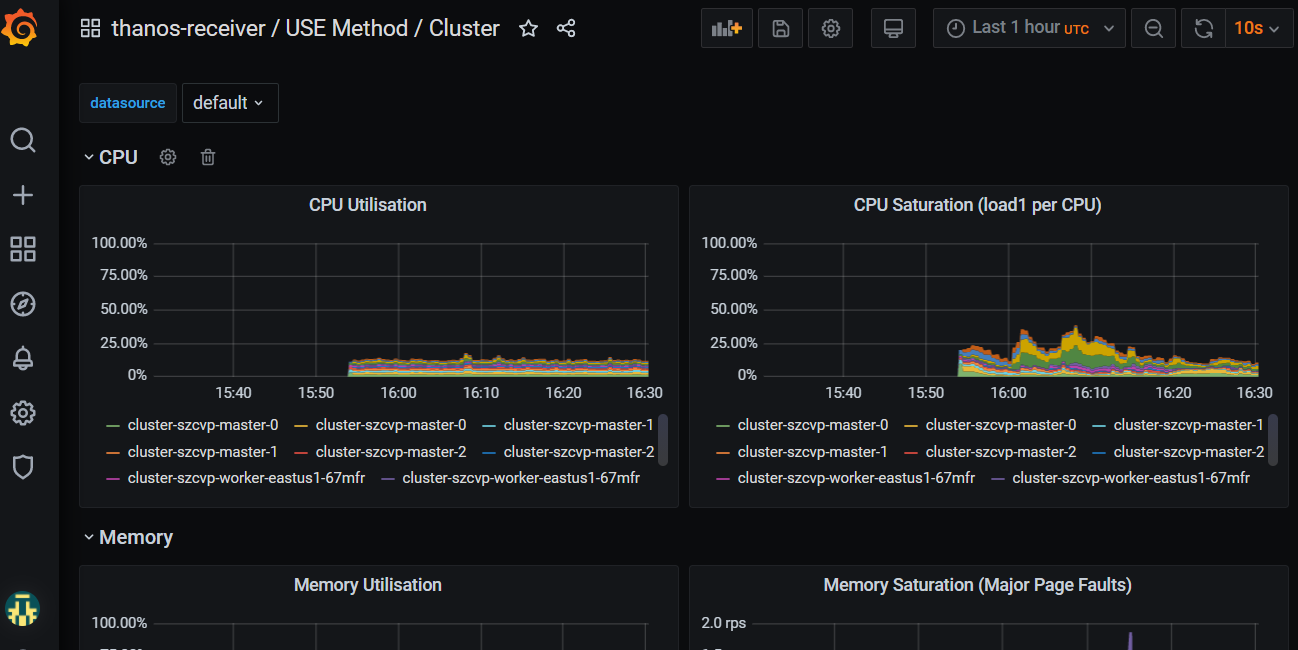
rootand the password you updated to (or the default ofsecret).oc -n thanos-receiver get route grafana-routeOnce logged in go to Dashboards->Manage and expand the federated-metrics group and you should see the cluster metrics dashboards. Click on the Use Method / Cluster Dashboard and you should see metrics. \o/.