Custom AlertManager in ROSA 4.9.x
This content is authored by Red Hat experts, but has not yet been tested on every supported configuration.
This page is deprecated. In order to get the best experience for custom alerting in ROSA, please upgrade your cluster to to 4.12 and follow the newer documentation.
ROSA 4.9.x introduces a new way to provide custom AlertManager configuration to receive alerts from User Workload Management.
The OpenShift Administrator can use the Prometheus Operator to create a custom AlertManager resource and then use the AlertManagerConfig resource to configure User Workload Monitoring to use the custom AlertManager.
Prerequisites
- AWS CLI
- A Red Hat OpenShift for AWS (ROSA) cluster 4.9.0 or higher
Create Environment Variables
Before we get started we need to set some environment variables to be used throughout the guide.
export PROM_NAMESPACE=custom-alert-manager
Install Prometheus Operator
If you prefer you can do this from the Operator Hub in the cluster console itself.
Create a OperatorGroup and Subscription for the Prometheus Operator
cat << EOF | kubectl apply -f -
---
apiVersion: v1
kind: Namespace
metadata:
  name: ${PROM_NAMESPACE}
---
apiVersion: operators.coreos.com/v1
kind: OperatorGroup
metadata:
  name: federated-metrics
  namespace: ${PROM_NAMESPACE}
spec:
  targetNamespaces:
  - ${PROM_NAMESPACE}
---
apiVersion: operators.coreos.com/v1alpha1
kind: Subscription
metadata:
  name: prometheus
  namespace: ${PROM_NAMESPACE}
spec:
  channel: beta
  installPlanApproval: Automatic
  name: prometheus
  source: community-operators
  sourceNamespace: openshift-marketplace
EOF
Deploy AlertManager
Create an Alert Manager Configuration file
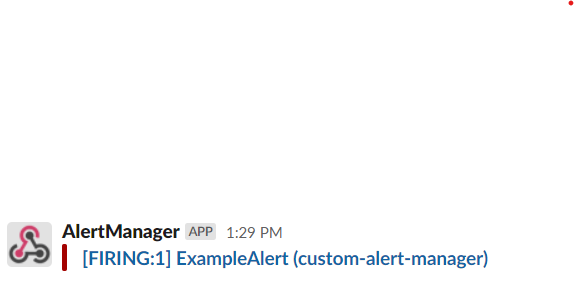
This will create a basic AlertManager configuration to send alerts to a slack channel. Configuring slack is outside the scope of this document. Update the variables to suit your slack integration.
SLACK_API_URL=https://hooks.slack.com/services/XXX/XXX/XXX
SLACK_CHANNEL='#paultest'
cat << EOF | kubectl apply -n ${PROM_NAMESPACE} -f -
apiVersion: v1
kind: Secret
metadata:
  name: custom-alertmanager
  namespace: ${PROM_NAMESPACE}
stringData:
  alertmanager.yaml: |
    global:
      slack_api_url: "${SLACK_API_URL}"
    route:
      receiver: slack-notifications
      group_by: [alertname]
    receivers:
    - name: slack-notifications
      slack_configs:
      - channel: ${SLACK_CHANNEL}
        send_resolved: true
---
apiVersion: monitoring.coreos.com/v1
kind: Alertmanager
metadata:
  name: custom-alertmanager
  namespace: ${PROM_NAMESPACE}
spec:
  securityContext: {}
  replicas: 3
  configSecret: custom-alertmanager
---
apiVersion: v1
kind: Service
metadata:
  name: custom-alertmanager
  namespace: ${PROM_NAMESPACE}
spec:
  type: ClusterIP
  ports:
  - name: web
    port: 9093
    protocol: TCP
    targetPort: web
  selector:
    alertmanager: custom-alertmanager
EOF
Configure User Workload Monitoring to use the custom AlertManager
Create an AlertManagerConfig for User Workload Monitoring
Note: This next command assumes the existing
config.yamlin theuser-workload-monitoring-configconfig map is empty. You should verify it withkubectl get -n openshift-user-workload-monitoring cm user-workload-monitoring-config -o yamland simply edit in the differences if its not.cat << EOF | kubectl apply -f - apiVersion: v1 kind: ConfigMap metadata: name: user-workload-monitoring-config namespace: openshift-user-workload-monitoring data: config.yaml: | thanosRuler: additionalAlertmanagerConfigs: - scheme: http pathPrefix: / timeout: "30s" apiVersion: v1 staticConfigs: ["custom-alertmanager.$PROM_NAMESPACE.svc.cluster.local:9093"] EOF
Create an Example Alert
Verify it works by creating a Prometheus Rule that will fire off an alert
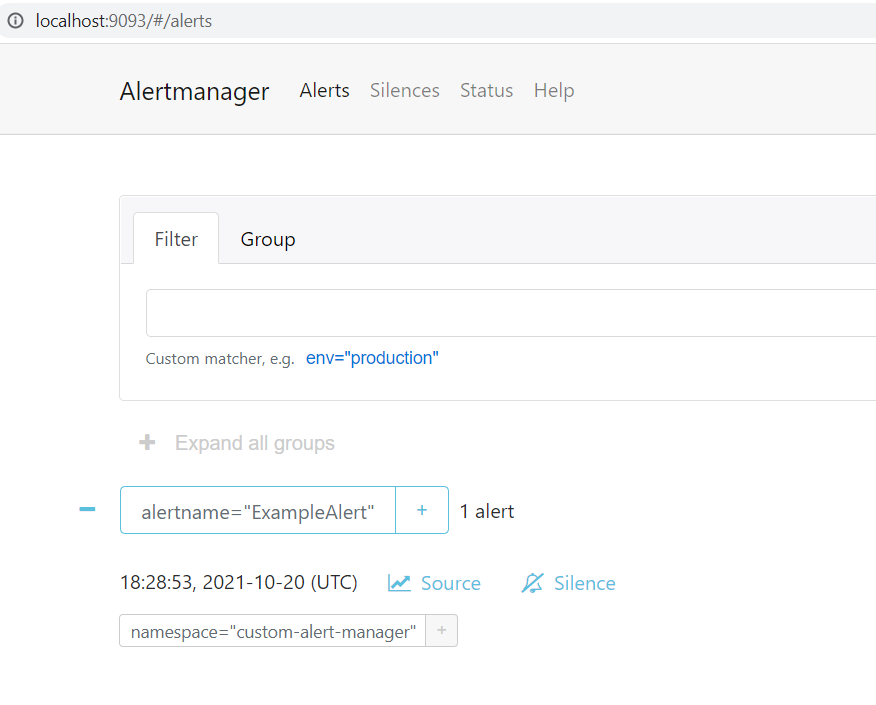
cat << EOF | kubectl apply -n $PROM_NAMESPACE -f -
apiVersion: monitoring.coreos.com/v1
kind: PrometheusRule
metadata:
  name: prometheus-example-rules
  namespace: ${PROM_NAMESPACE}
spec:
  groups:
  - name: example.rules
    rules:
    - alert: ExampleAlert
      expr: vector(1)
EOF
Forward a port to the alert manager service
kubectl port-forward -n ${PROM_NAMESPACE} svc/custom-alertmanager 9093:9093Browse to http://localhost:9093/#/alerts to see the alert “ExampleAlert”
Check the Alert was sent to Slack