ROSA - Federating Metrics to AWS Prometheus
This content is authored by Red Hat experts, but has not yet been tested on every supported configuration.
Federating Metrics from ROSA/OSD is a bit tricky as the cluster metrics require pulling from its /federated endpoint while the user workload metrics require using the prometheus remoteWrite configuration.
This guide will walk you through using the MOBB Helm Chart to deploy the necessary agents to federate the metrics into AWS Prometheus and then use Grafana to visualize those metrics.
As a bonus it will set up a CloudWatch datasource to view any metrics or logs you have in Cloud Watch.
Make sure to use a region where Amazon Prometheus service is supported
Prerequisites
- A ROSA cluster deployed with STS
- aws CLI
- jq
Set up environment
Create environment variables
export CLUSTER=my-cluster
export REGION=us-east-2
export PROM_NAMESPACE=custom-metrics
export PROM_SA=aws-prometheus-proxy
export SCRATCH_DIR=/tmp/scratch
export OIDC_PROVIDER=$(oc get authentication.config.openshift.io cluster -o json | jq -r .spec.serviceAccountIssuer| sed -e "s/^https:\/\///")
export AWS_ACCOUNT_ID=$(aws sts get-caller-identity --query Account --output text)
export AWS_PAGER=""
mkdir -p $SCRATCH_DIR
Create namespace
oc new-project $PROM_NAMESPACE
Deploy Operators
Add the MOBB chart repository to your Helm
helm repo add mobb https://rh-mobb.github.io/helm-charts/Update your repositories
helm repo updateUse the
mobb/operatorhubchart to deploy the needed operatorshelm upgrade -n $PROM_NAMESPACE custom-metrics-operators \ mobb/operatorhub --version 0.1.1 --install \ --values https://raw.githubusercontent.com/rh-mobb/helm-charts/main/charts/rosa-aws-prometheus/files/operatorhub.yaml
Deploy and Configure the AWS Sigv4 Proxy and the Grafana Agent
Create a Policy for access to AWS Prometheus
cat <<EOF > $SCRATCH_DIR/PermissionPolicyIngest.json
{
  "Version": "2012-10-17",
   "Statement": [
       {"Effect": "Allow",
        "Action": [
           "aps:RemoteWrite",
           "aps:GetSeries",
           "aps:GetLabels",
           "aps:GetMetricMetadata"
        ],
        "Resource": "*"
      }
   ]
}
EOF
Apply the Policy
PROM_POLICY=$(aws iam create-policy --policy-name $PROM_SA-prom \
  --policy-document file://$SCRATCH_DIR/PermissionPolicyIngest.json \
  --query 'Policy.Arn' --output text)
echo $PROM_POLICY
Create a Policy for access to AWS CloudWatch
cat <<EOF > $SCRATCH_DIR/PermissionPolicyCloudWatch.json
{
    "Version": "2012-10-17",
    "Statement": [
        {
            "Sid": "AllowReadingMetricsFromCloudWatch",
            "Effect": "Allow",
            "Action": [
                "cloudwatch:DescribeAlarmsForMetric",
                "cloudwatch:DescribeAlarmHistory",
                "cloudwatch:DescribeAlarms",
                "cloudwatch:ListMetrics",
                "cloudwatch:GetMetricStatistics",
                "cloudwatch:GetMetricData"
            ],
            "Resource": "*"
        },
        {
            "Sid": "AllowReadingLogsFromCloudWatch",
            "Effect": "Allow",
            "Action": [
                "logs:DescribeLogGroups",
                "logs:GetLogGroupFields",
                "logs:StartQuery",
                "logs:StopQuery",
                "logs:GetQueryResults",
                "logs:GetLogEvents"
            ],
            "Resource": "*"
        },
        {
            "Sid": "AllowReadingTagsInstancesRegionsFromEC2",
            "Effect": "Allow",
            "Action": [
                "ec2:DescribeTags",
                "ec2:DescribeInstances",
                "ec2:DescribeRegions"
            ],
            "Resource": "*"
        },
        {
            "Sid": "AllowReadingResourcesForTags",
            "Effect": "Allow",
            "Action": "tag:GetResources",
            "Resource": "*"
        }
    ]
}
EOF
Apply the Policy
CW_POLICY=$(aws iam create-policy --policy-name $PROM_SA-cw \
  --policy-document file://$SCRATCH_DIR/PermissionPolicyCloudWatch.json \
  --query 'Policy.Arn' --output text)
echo $CW_POLICY
Create a Trust Policy
cat <<EOF > $SCRATCH_DIR/TrustPolicy.json
{
  "Version": "2012-10-17",
  "Statement": [
    {
      "Effect": "Allow",
      "Principal": {
        "Federated": "arn:aws:iam::${AWS_ACCOUNT_ID}:oidc-provider/${OIDC_PROVIDER}"
      },
      "Action": "sts:AssumeRoleWithWebIdentity",
      "Condition": {
        "StringEquals": {
          "${OIDC_PROVIDER}:sub": [
            "system:serviceaccount:${PROM_NAMESPACE}:${PROM_SA}",
            "system:serviceaccount:${PROM_NAMESPACE}:grafana-serviceaccount"
          ]
        }
      }
    }
  ]
}
EOF
Create Role for AWS Prometheus and CloudWatch
PROM_ROLE=$(aws iam create-role \
  --role-name "prometheus-$CLUSTER" \
  --assume-role-policy-document file://$SCRATCH_DIR/TrustPolicy.json \
  --query "Role.Arn" --output text)
echo $PROM_ROLE
Attach the Policies to the Role
aws iam attach-role-policy \
  --role-name "prometheus-$CLUSTER" \
  --policy-arn arn:aws:iam::aws:policy/AmazonPrometheusQueryAccess

aws iam attach-role-policy \
  --role-name "prometheus-$CLUSTER" \
  --policy-arn $CW_POLICY
Create an AWS Prometheus Workspace
PROM_WS=$(aws amp create-workspace --alias $CLUSTER \
  --query "workspaceId" --output text)
echo $PROM_WS
Deploy AWS Prometheus Proxy Helm Chart
helm upgrade --install -n $PROM_NAMESPACE --set "aws.region=$REGION" \
--set "aws.roleArn=$PROM_ROLE" --set "fullnameOverride=$PROM_SA" \
--set "aws.workspaceId=$PROM_WS" \
--set "grafana-cr.serviceAccountAnnotations.eks\.amazonaws\.com/role-arn=$PROM_ROLE" \
 aws-prometheus-proxy mobb/rosa-aws-prometheus
Configure remoteWrite for user workloads
 cat << EOF | kubectl apply -f -
 apiVersion: v1
 kind: ConfigMap
 metadata:
   name: user-workload-monitoring-config
   namespace: openshift-user-workload-monitoring
 data:
   config.yaml: |
     prometheus:
       remoteWrite:
         - url: "http://aws-prometheus-proxy.$PROM_NAMESPACE.svc.cluster.local:8005/workspaces/$PROM_WS/api/v1/remote_write"
 EOF
Verify Metrics are being collected
Access Grafana and check for metrics
oc get route -n custom-metrics grafana-route -o jsonpath='{.status.ingress[0].host}'Browse to the URL provided in the above command and log in with your OpenShift Credentials
Enable Admin by hitting sign in and user
adminandpasswordBrowse to
/datasourcesand verify thatcloudwatchandprometheusare presentIf not, you may have hit a race condition that can be fixed by running the following then trying again
kubectl delete grafanadatasources.integreatly.org aws-prometheus-proxy-prometheus
helm upgrade --install -n $PROM_NAMESPACE --set "aws.region=$REGION" \
  --set "aws.roleArn=$PROM_ROLE" --set "fullnameOverride=$PROM_SA" \
  --set "aws.workspaceId=$PROM_WS" \
  --set "grafana-cr.serviceAccountAnnotations.eks\.amazonaws\.com/role-arn=$PROM_ROLE" \
  aws-prometheus-proxy mobb/rosa-aws-prometheus
Browse to
/dashboardsand select the custom-metrics->NodeExporter / Use Method / Cluster dashboard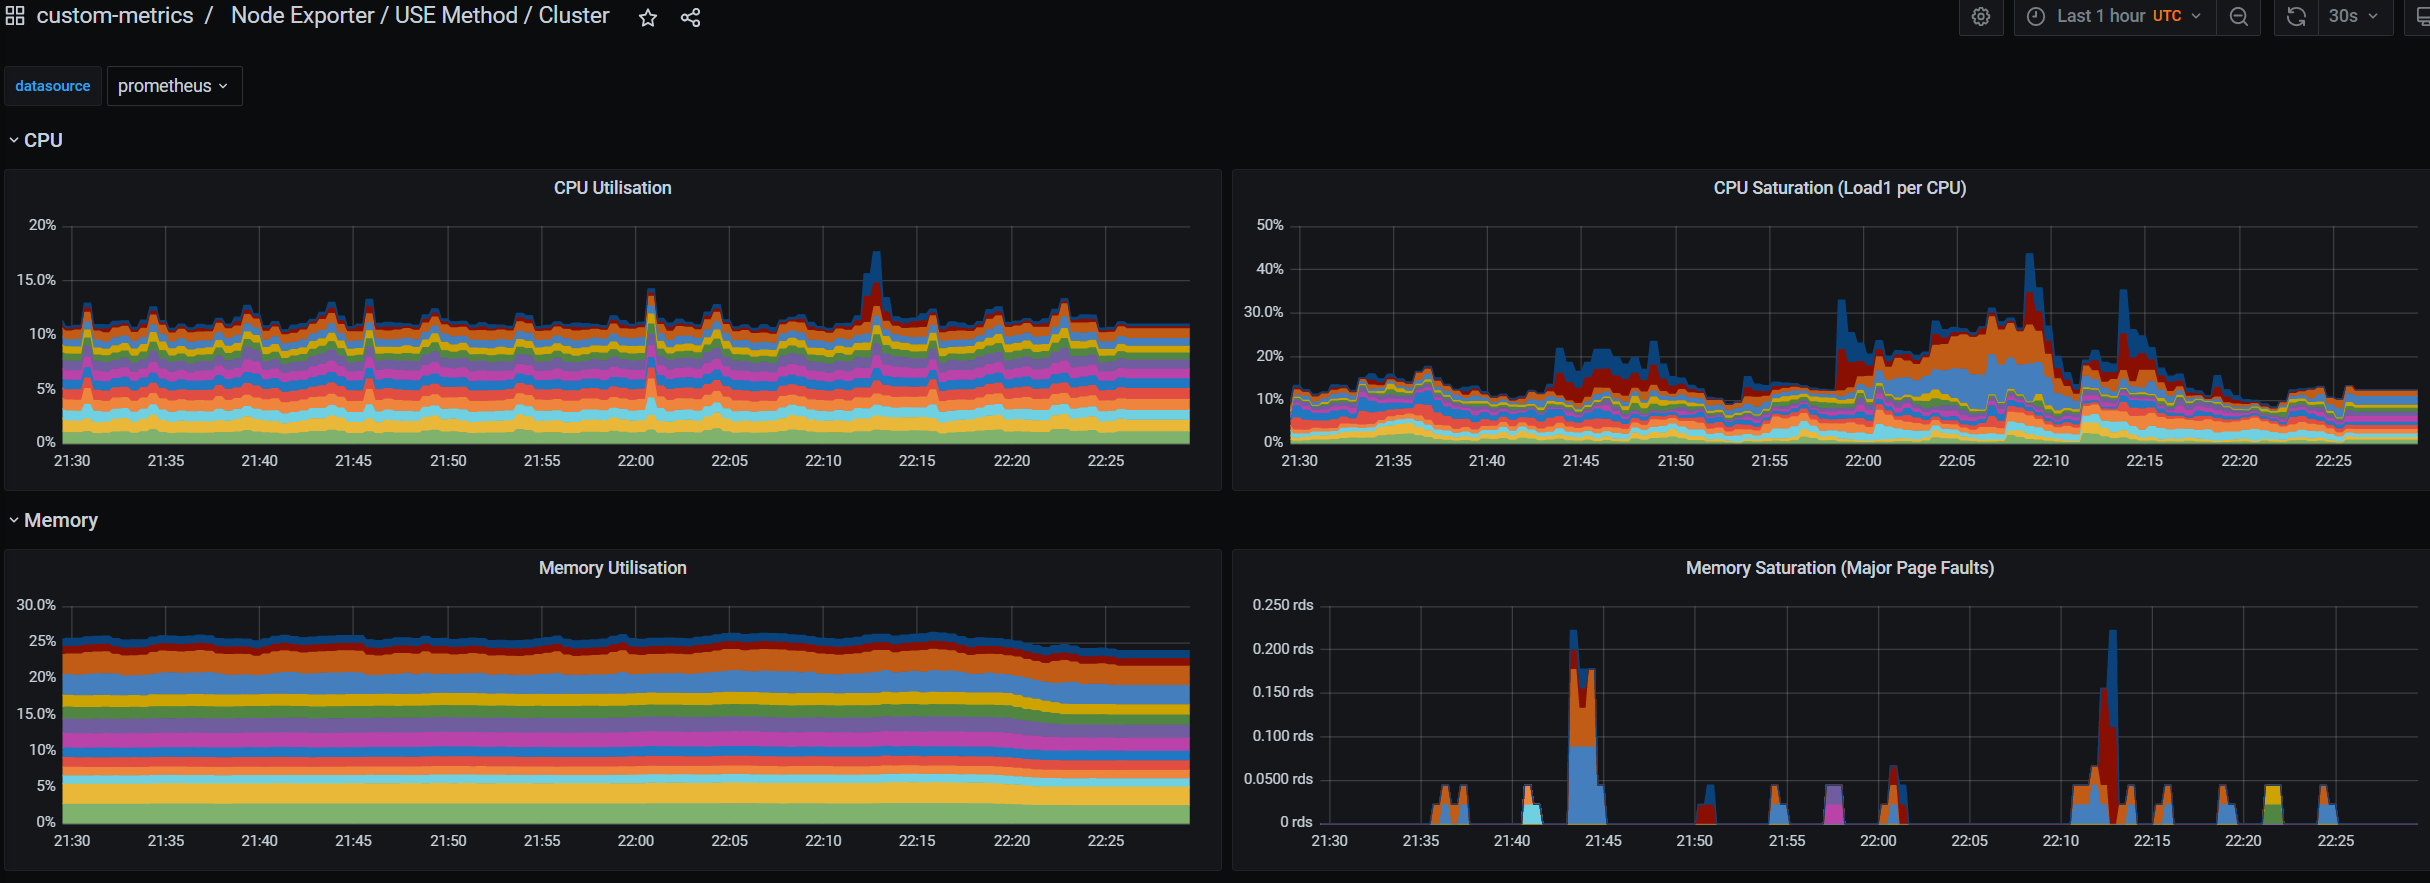
Cleanup
Delete the
aws-prometheus-proxyHelm Releasehelm delete -n custom-metrics aws-prometheus-proxyDelete the
custom-metrics-operatorsHelm Releasehelm delete -n custom-metrics custom-metrics-operatorsDelete the
custom-metricsnamespacekubectl delete namespace custom-metricsDetach AWS Role Policies
aws iam detach-role-policy \
  --role-name "prometheus-$CLUSTER" \
  --policy-arn arn:aws:iam::aws:policy/AmazonPrometheusQueryAccess

aws iam detach-role-policy \
  --role-name "prometheus-$CLUSTER" \
  --policy-arn $CW_POLICY
Delete the custom Cloud Watch Policy
aws iam delete-policy --policy-arn $CW_POLICYDelete the AWS Prometheus Role
aws iam delete-role --role-name "prometheus-$CLUSTER"Delete AWS Prometheus Workspace
aws amp delete-workspace --workspace-id $PROM_WS