Deploying Grafana on Openshift 4
This content is authored by Red Hat experts, but has not yet been tested on every supported configuration.
OpenShift users want access to a Grafana interface in order to build custom dashboards for their cluster and application workloads. The Grafana that shipped with OpenShift was read-only and has been deprecated in OpenShift 4.11 and removed in OpenShift 4.12 .
Since OpenShift uses Prometheus for both Cluster and User Workload metrics, its fairly straight forward to deploy a Grafana instance using the Grafana Operator and then view those cluster metrics and create custom Dashboards.
Grafana Operator
Create a namespace for the Grafana Operator to be installed in
oc new-project grafana-operatorDeploy the Grafana Operator
cat << EOF | oc create -f -
apiVersion: operators.coreos.com/v1
kind: OperatorGroup
metadata:
  generateName: grafana-operator-
  namespace: grafana-operator
spec:
  targetNamespaces:
  - grafana-operator
---
apiVersion: operators.coreos.com/v1alpha1
kind: Subscription
metadata:
  generateName: grafana-operator-
  namespace: grafana-operator
spec:
  channel: v4
  name: grafana-operator
  installPlanApproval: Automatic
  source: community-operators
  sourceNamespace: openshift-marketplace
EOF
Wait for the Operator to be ready
oc -n grafana-operator rollout status \
  deployment grafana-operator-controller-manager
Deploy Grafana
Add the Managed OpenShift Black Belt helm repo
helm repo add mobb https://rh-mobb.github.io/helm-charts/Deploy Grafana
helm upgrade --install -n grafana-operator \
  grafana mobb/grafana-cr --set "basicAuthPassword=myPassword"
Create Prometheus DataSource
Give the Grafana service account the
cluster-monitoring-viewroleoc adm policy add-cluster-role-to-user \ cluster-monitoring-view -z grafana-serviceaccountGet a bearer token for the grafana service account
BEARER_TOKEN=$(oc create token grafana-serviceaccount)Deploy the prometheus data source
cat << EOF | oc apply -f -
apiVersion: integreatly.org/v1alpha1
kind: GrafanaDataSource
metadata:
  name: prometheus-grafanadatasource
spec:
  datasources:
    - access: proxy
      editable: true
      isDefault: true
      jsonData:
        httpHeaderName1: 'Authorization'
        timeInterval: 5s
        tlsSkipVerify: true
      name: Prometheus
      secureJsonData:
        httpHeaderValue1: 'Bearer ${BEARER_TOKEN}'
      type: prometheus
      url: 'https://thanos-querier.openshift-monitoring.svc.cluster.local:9091'
  name: prometheus-grafanadatasource.yaml
EOF
Deploy a Dashboard
oc apply -f https://raw.githubusercontent.com/kevchu3/openshift4-grafana/master/dashboards/crds/cluster_metrics.ocp412.grafanadashboard.yamlGet the URL for Grafana
oc get route grafana-route -o jsonpath='{"https://"}{.spec.host}{"\n"}'Browse to the URL from above, log in via your OCP credentials
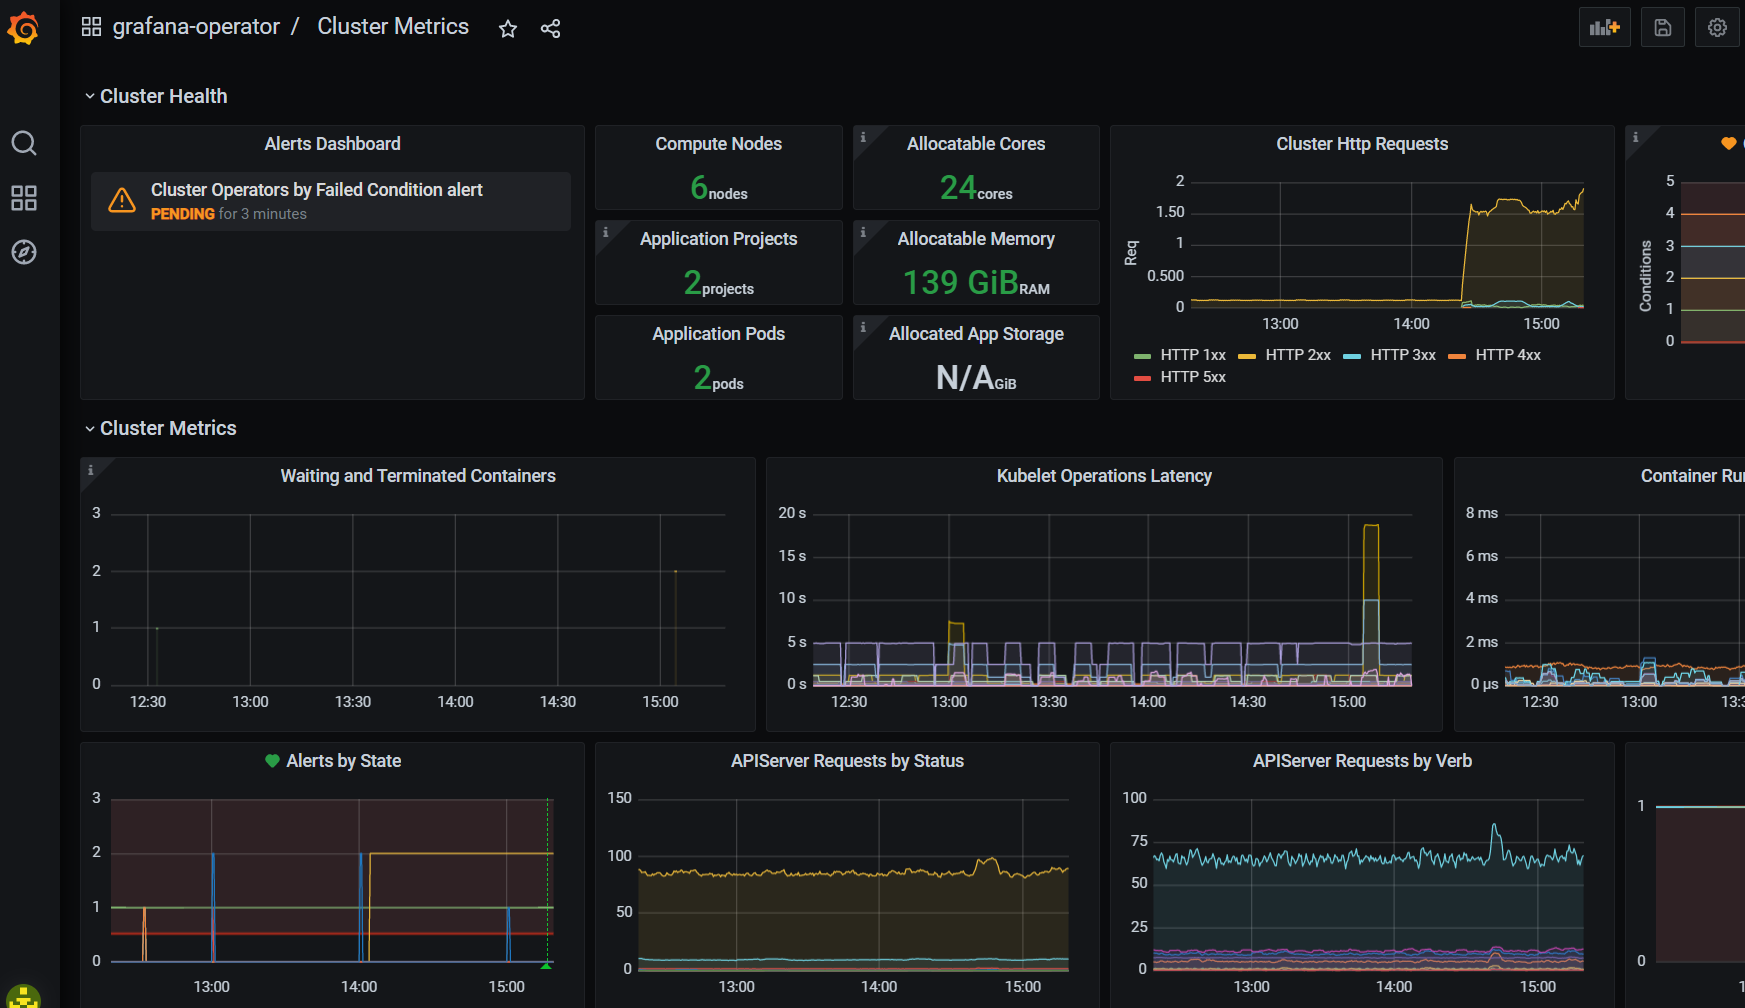
Click Dashboards -> Manage -> grafana-operator -> Cluster Metrics