Federating System and User metrics to Azure Files in Azure Red Hat OpenShift
This content is authored by Red Hat experts, but has not yet been tested on every supported configuration.
By default Azure Red Hat OpenShift (ARO) stores metrics in Ephemeral volumes, and its advised that users do not change this setting. However its not unreasonable to expect that metrics should be persisted for a set amount of time.
This guide shows how to set up Thanos to federate both System and User Workload Metrics to a Thanos gateway that stores the metrics in Azure Files and makes them available via a Grafana instance (managed by the Grafana Operator).
ToDo - Add Authorization in front of Thanos APIs
Pre-Prequsites
Set some environment variables to use throughout to suit your environment
Note: AZR_STORAGE_ACCOUNT_NAME must be unique
export AZR_RESOURCE_LOCATION="eastus"
export AZR_RESOURCE_GROUP="openshift"
export CLUSTER_NAME="openshift"
export UNIQUE="$(cat /dev/urandom | LC_ALL=C tr -dc 'a-z0-9' | fold -w 5 | head -n 1)"
export AZR_STORAGE_ACCOUNT_NAME="arometrics${UNIQUE}"
export NAMESPACE="aro-thanos-af"
Azure Preperation
Create an Azure storage account
modify the arguments to suit your environment
az storage account create \
  --name $AZR_STORAGE_ACCOUNT_NAME \
  --resource-group $AZR_RESOURCE_GROUP \
  --location $AZR_RESOURCE_LOCATION \
  --sku Standard_RAGRS \
  --kind StorageV2
Get the account key and update the secret in
thanos-store-credentials.yamlAZR_STORAGE_KEY=$(az storage account keys list -g $AZR_RESOURCE_GROUP \ -n $AZR_STORAGE_ACCOUNT_NAME --query "[0].value" -o tsv)Create a namespace to use
oc new-project $NAMESPACEAdd the MOBB chart repository to your Helm
helm repo add mobb https://rh-mobb.github.io/helm-charts/Update your repositories
helm repo updateUse the
mobb/operatorhubchart to deploy the grafana operatorhelm upgrade -n $NAMESPACE grafana-operator \ mobb/operatorhub --install \ --values https://raw.githubusercontent.com/rh-mobb/helm-charts/main/charts/aro-thanos-af/files/grafana-operator.yamlWait for the Operator to be ready
oc rollout status -n $NAMESPACE \
  deployment/grafana-operator-controller-manager
Use Helm deploy the OpenShift Patch Operator
helm upgrade -n patch-operator patch-operator --create-namespace \
  mobb/operatorhub --install \
  --values https://raw.githubusercontent.com/rh-mobb/helm-charts/main/charts/aro-thanos-af/files/patch-operator.yaml
Wait for the Operator to be ready
oc rollout status -n patch-operator \
  deployment/patch-operator-controller-manager
Deploy ARO Thanos Azure Files Helm Chart (mobb/aro-thanos-af)
**> Note:
enableUserWorkloadMetrics=truewill overwrite configs for cluster and userworkload metrics. If you have customized them already, you may need to modifypatch-monitoring-configs.yamlin the Helm chart to include your changes.helm upgrade -n $NAMESPACE aro-thanos-af \ --install mobb/aro-thanos-af \ --set "aro.storageAccount=$AZR_STORAGE_ACCOUNT_NAME" \ --set "aro.storageAccountKey=$AZR_STORAGE_KEY" \ --set "aro.storageContainer=$CLUSTER_NAME" \ --set "aro.clusterName=$CLUSTER_NAME" \ --set "enableUserWorkloadMetrics=true"
Validate Grafana is installed and seeing metrics from Azure Files
get the Route URL for Grafana (remember its https) and login using username
adminand the passwordpassword.oc -n $NAMESPACE get route grafana-routeOnce logged in go to Dashboards->Manage and expand the aro-thanos-af group and you should see the cluster metrics dashboards. Click on the Use Method / Cluster Dashboard and you should see metrics. \o/.
Note: If it complains about a missing datasource run the following:
oc annotate -n $NAMESPACE grafanadatasource aro-thanos-af-prometheus "retry=1"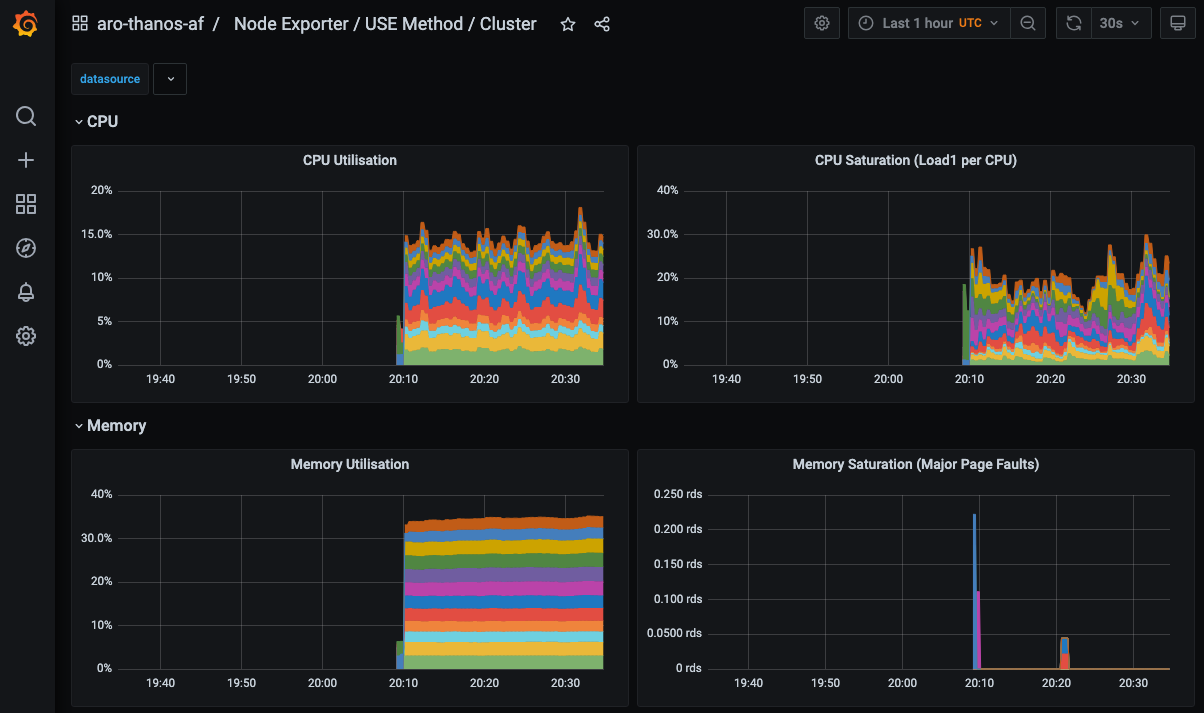
Cleanup
Uninstall the
aro-thanos-afcharthelm delete -n $NAMESPACE aro-thanos-afUninstall the
federated-metrics-operatorscharthelm delete -n $NAMESPACE federated-metrics-operatorsDelete the
aro-thanos-afnamespaceoc delete namespace $NAMESPACEDelete the storage account
az storage account delete \
  --name $AZR_STORAGE_ACCOUNT_NAME \
  --resource-group $AZR_RESOURCE_GROUP